Ah, the age-old brand question: “Is this ad good? Will it resonate emotionally with customers? How will I know?” And though it’s a simple question, the answer is complex, and not ideal:
"Well, it depends."
Let’s unpack how you can figure this out as it applies to your ad after working with our product by examining understandable definitions of our metrics - it’s actually easier than you think.
Wait, but who are we to tell you?
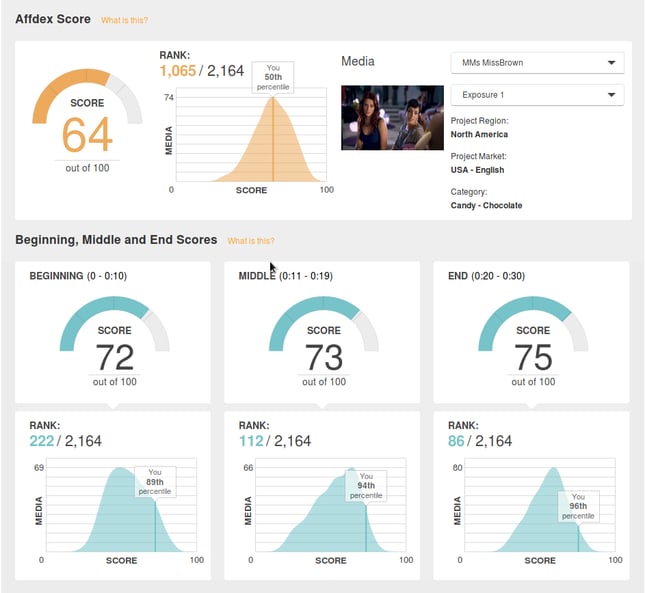
Well, at Affectiva, we have built industry-leading norms and benchmarks. Our dataset also allowed us to build what is by far the world’s largest facial expression normative database, a benchmark of what responses to expect in each region of the world. We have exposed these norms in our market research product, so that our clients can benchmark the performance of their ads based on geography, product category and media length. No other emotion analysis vendor provides these type of norms.

Example of emotional scores in our Affdex for Market Research product
The Problem: Measuring Viewer Engagement
How to Understand if an ad resonates with your viewer
Here’s how we know where you, the market researcher (also our core customer base) is coming from. You are coming from a very black and white world - a world where “the dial” was the ultimate tool by which a consumer decided whether they liked content or not. If a viewed liked the content, they turned the dial one way. If they didn’t, they turned it the opposite way. Column A for yes, Column B for no. One number. As a result, your reporting back to the brand simply visualized percentages of the people who liked their ad content, and people who did not. Easy, right? Emotionally accurate? Maybe not so much.
We know that certain biases exist in the market group that you are testing. Viewers need to think about the content, and then turn the dial. In many cases, we know that viewers simply turn the dial the way they think the testers want them to turn it. So the validity of your ad test results can vary.
And listen - we know the dial isn’t going away anytime soon. What we do know is that we can enhance your testing methodology with an unfiltered, unbiased emotion layer that can tell you exactly how ads are resonating with viewers by looking at the expressions on their face. We measure 7 different human, understandable emotions - we all know what joy and anger are. But when we get down to expressiveness and valence, it can be easy to get into trouble. So let’s cover how to approach presenting top-line results to end clients.
...But is my ad good?
Don’t worry: our report has a yes and a no for you, so you’ll still have that. But in addition, we have 30 metrics that go up and down in different ways. So remember how I said “it depends”? That’s because when it comes to scores highlighted on our dashboard, there are no good or bad metrics. Rather, it’s all about communicating ad effectiveness in terms of whether it succeeded in provoking the desired emotion from viewers. Let’s start with the Valence metric.
Valence is a measure of net positivity: so if a viewer smiles, it makes the valence line go up. If a viewer expresses contempt, this line would render as a negative valence. However, high valence doesn’t always equal a good ad. Or, just because humans have emotions & are happy all the time doesn’t mean it’s a good thing as it relates to your ad. What if an ad objective was to scare you, like a horror movie trailer - where, presumably, you would not want the audience to smile?
Once you examine valence, take a look at expressiveness. Your expressiveness line is probably the most natural analog to dial, as it indicates whether a viewer had ANY emotional response to stimulus. This line shows that viewers are engaged and that they are emoting.
Understanding Valence: What emotion is your ad designed to elicit?
To digest valence, you have to refocus on the context by which your ad is delivered. Which emotion is this ad designed to provoke? Then, we can help you to set up your dashboard around a particular context in order to most efficiently extract metrics of success based on what emotion the ad is attempting to convey.
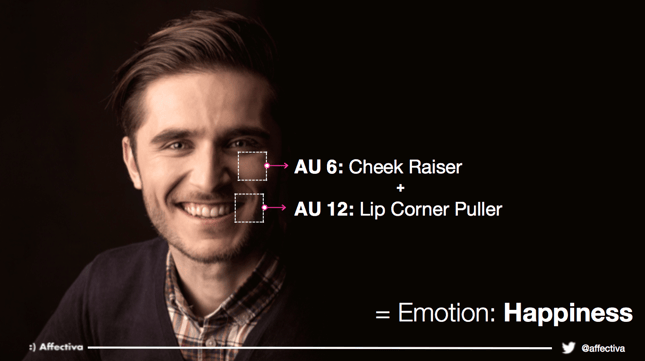
To take you through an example, if your ad was designed to surprise the viewer, you would look for positive indicators that reflect the emotion of surprise. In this example, Surprise is represented by the combination of AU 1(Inner Brow Raiser) + AU 2 (Outer Brow Raiser) + AU 5B (Slight Upper Lid Raiser) +26 (Jaw Drop) Learn more at this article on FACs and the correct combination of Action Units (AUs) for each emotion)

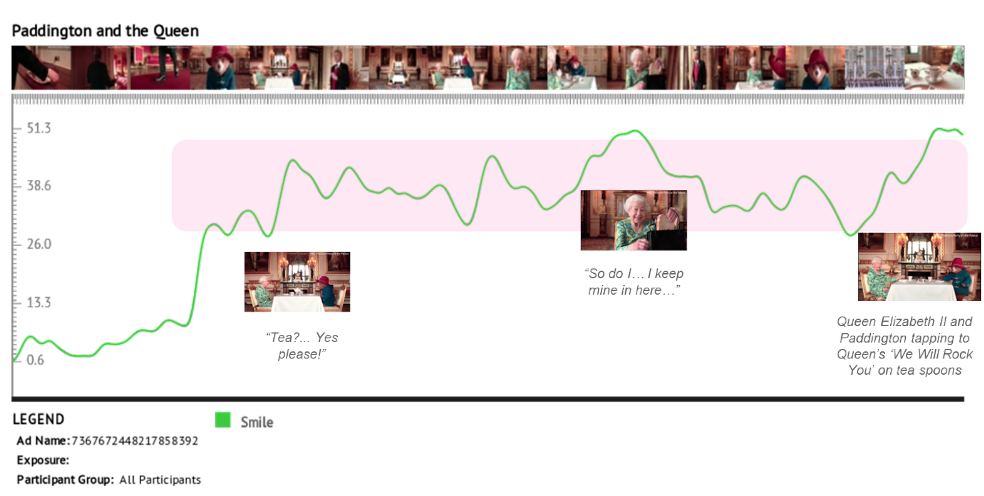
There are nuances, and as a market researcher, you won’t necessarily need all of our 30 metrics, but they are there if needed! :) From experience, we see certain metrics fire much more often in respondents that aren’t necessarily emotions - so we include those individual AUs in your dashboard as well to account for harder to read facial expressions. These include smiles, smirks, nose wrinkles - we have individual metrics for those as well, so you can see where exactly in your ad respondents smiled the most.
Does your ad tell a story?
The best ads tell a story to emotionally engage the viewer (we are also now able to now process longer-form content as well, so you can see emotional responses to actual stories in a network’s latest pilot TV episode, for example). We help market researchers to test the emotional ride of their viewers to whatever stimuli they are presented with. So, yes, with our technology it’s not about glancing at quick results - but rather, it is a tool to help brands determine whether they have achieved their objectives.


