By Jim Deal, Director of Market Development and Games at Affectiva and Forest Handford, Affectiva Games Evangelist
How Emotion Data can take some of the risk out of your next launch.
Why Emotion Data and What to Use
Game development is an expensive proposition. The budgets for mobile games these days have increased astronomically, and the pressure to perform as soon as they hit the street is staggering. With hundreds of new titles out every week, even small mistakes can be the difference between success and failure. Thus the strategies around a mobile launch become a carefully orchestrated series of ever widening circles; closed beta, open beta, soft launch and then finally the full launch. Every new feature is scrutinized, tested, repaired and reintroduced. Then tested, repaired etc. etc.
All games benefit from refinements that come from playtesting. The majority of playtesting in today’s game development industry is based on surveys given to participants after they try the game. Often the people who playtest games have a bias towards game companies and the industry because of their love of games. Some playtesters even hope to become game developers which gives a positive bias to survey-based feedback.
One way to minimize the risk of bias is to make your testing more efficient by gathering data on the emotional reactions of a player, i.e. “emotion data”. Emotion data can tell you things about the user that you would not get from survey and especially not on the scale of most beta tests. Emotion data is something substantial that the developer can use to identify problem areas as well as areas of positive user experience. This type of data can also help to profile a whale, for example, or to give better information on a quit event. Is the quit event a rage quit or just a “I have to go to work now” quit? One way to find out is to record emotion data during your test. Once you have data you can look back a few minutes and look not only for frustration indications, but also look at where they happen exactly. In this way you can maximize your team’s time and create the best possible experience for your user. A better experience means longer and more frequent play times. This factors into increased retention and increased retention maximizes the probability of revenue.
The next question you might ask is: How do I gather emotion data from a mobile game? Affectiva is a company that has emotion recognition tech that can enable a game developer to gather emotional data from a game using just a webcam or phone cam. Affectiva’s solution is easily installed and run from your mobile device, so this is the solution we will discuss today. All you will have to do with Affectiva’s solution is integrate it into your game and ask your beta tester to turn on the camera. Part Two below will show you how to record emotion data from a tester session. Part three will show one way to view your collected data.
Part one: Integrating Affectiva emotion tech in game
A suite of Affectiva Unity plugins make integration super easy. This can be done in under 4 hours. Watch the video on this page to see how easy it is to use the Unity plugin.
Part two: Saving the data
Once you have the Affectiva Unity plugin installed, it will be spitting out emotion data for your use. What do you do with it?
Most of what we have discussed in the past for Affectiva’s Unity plugin has been about adapting games based on player emotions.
(See: http://blog.affectiva.com/emotions-in-gaming-passive-vs.-interactive-experiences) Not all games are conducive to emotion adaptation but all games need refinement through playtesting. During playtesting, and even after launch, Unity games can collect unbiased feedback using our plugin.
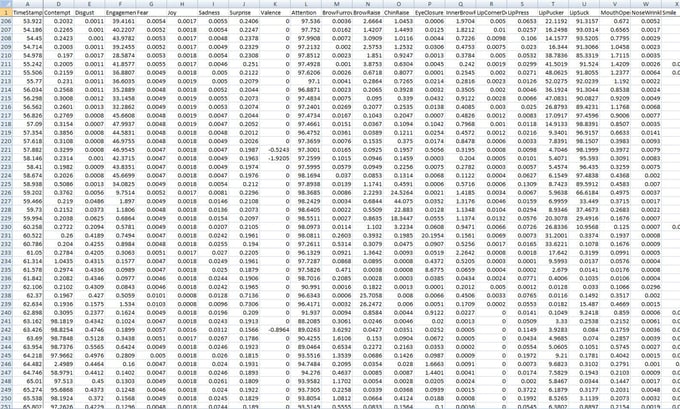
I’ve created a very simple Unity example that records player emotions in real time and files them to a local CSV file that looks like this:
Into The Space is a fun 2D space shooter created by Bug Games. Bug Games generously shares their game on the Unity Asset Store through a creative commons license.
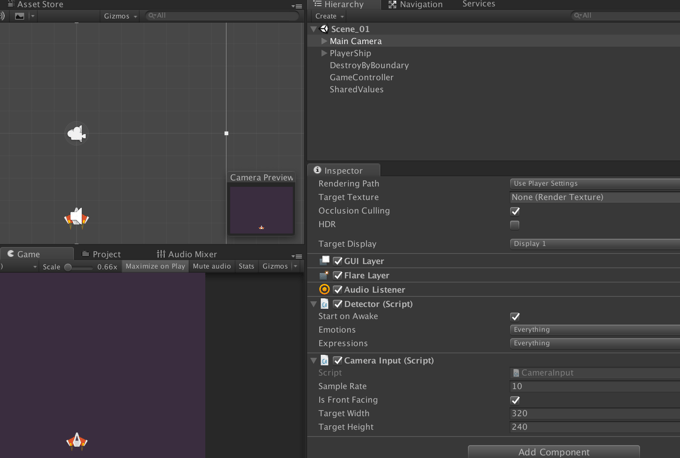
In order to record the metrics, I first imported the Affectiva plugin from the developer portal. I then opened the scene and added the scripts from the Affdex folder called Detector and CameraInput. I set the detector to record all emotions and expressions, but you might want to reduce the number based on what interests you and the performance impact of having them all read at once. I set the sample rate to a moderate 10 frames per second and a resolution of 320 x 240:
Next I created a script called PlayerEmotions.cs and attached it to the scene. I attached it to PlayerShip, but you could also attach it the Main Camera. I created a start function that creates a new CSV file that includes the date and time in it’s file name. The Start function also populates the CSV’s header.
The PlayerEmotions class inherits from ImageResultsListener and must implement onFaceFound, onFaceLost, and onImageResults. All the magic happens in OnImageResults, which is called everytime a frame is processed (regardless of if it finds a face). When a face is found, all of the current emotion and expression values are saved as a line in the CSV file. Face measurements and feature points could also be recorded, but I decided there were not as useful so I left them out. If no faces are found, OnImageResults will write the time stamp and fill the rest of the cells with “NaN” to indicate that no number was recorded.
While I only recorded emotion and expression metrics with a time stamp, you could also record information about the game state like when the player was hit, when a player destroyed an object, the player’s location in the game, or when the player died. With this information you could look for the emotional peaks and valleys and see how they related to game events. You can than use this information to ask more details from the player like, “I saw you were happy after your ship was destroyed, why was that?” With all of this information you can make changes to the game to increase engagement and joy. You can also reduce player quits by seeing the trends that lead to player’s quitting and reducing them.
Part three: Viewing the data
Gather the Data
The first step in analysis will be to gather the data. You will need to collect all the saved .csv files from your test devices and make sure they are all uniquely named. The put them all into one folder. (if they are not already)
For this tutorial, we are going to discuss Tableau as a data visualization tool. There are other options. If you know R the dplyr and ggplot2 libraries work for data manipulation and visualization respectively, and in Python, you might use data manipulation using the pandas and numpy libraries, with visualization in seaborn/ pandas. The data scientists in the audience can stop here and do their thing. I am not a data scientist and do not use these scripting tools. However I have found that Tableau can make some of these visualizations very easy.
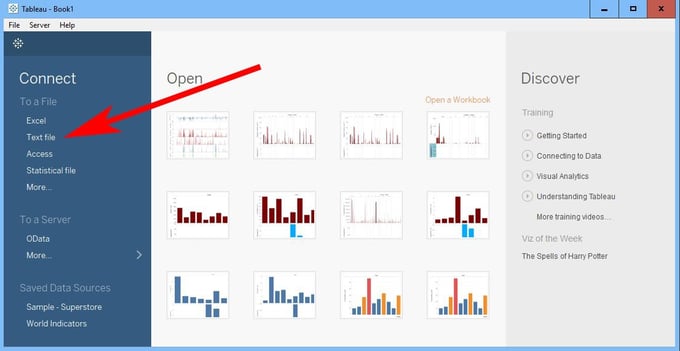
Import your CSVs using Tableau
The first step would be to open Tableau and begin a new project. Under “Connect” choose “Text File”
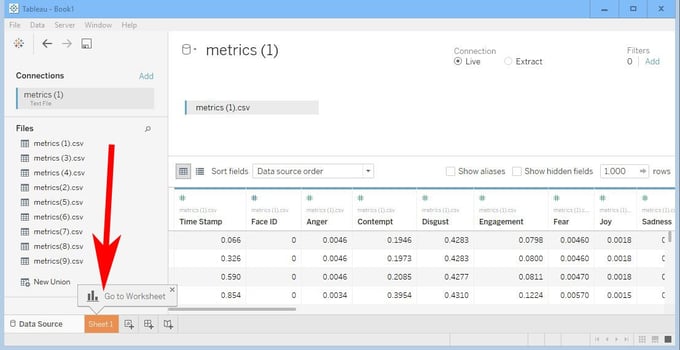
Then navigate to the folder that contains your .CSV data files. Choose the first .CSV file in the list and hit connect. You should get a screen that shows the first CSV file under Connections, and under it a list of all the CSV files in the folder.
If you do not have task data and if your game is not on a linear timeline (and most are not), you will probably only want to view each file separately. To do this simply connect with the CSV file you want to view. Then go to Sheet one.
Once in sheet one, there are a number of steps to take:
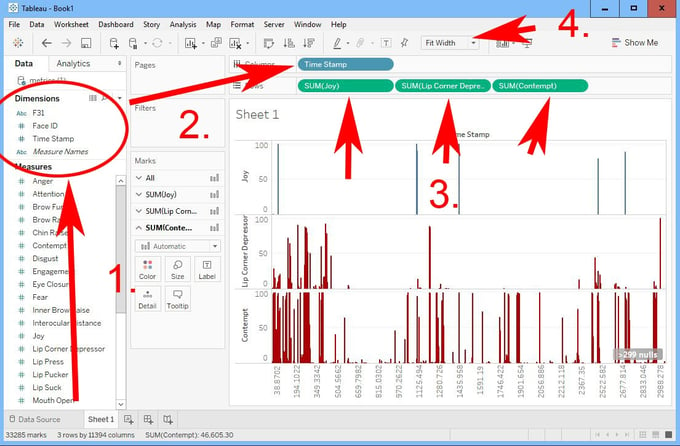
- Drag “Time Stamp” from the Measures section to the Dimensions section
- Drag “Time Stamp” from Dimensions to the Columns slot.
- Drag “Joy”, “Lip Corner Depressor” and “Contempt” to the rows slot
- In the drop down indicated, choose “Fit Width”
Next, make sure you are looking at a bar graph:
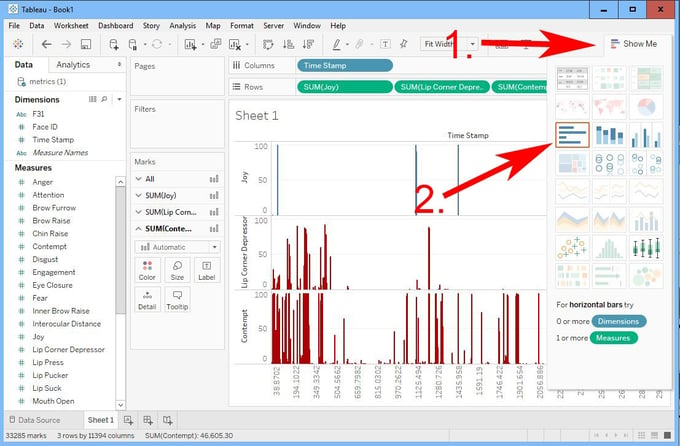
- Click on “Show Me”
- In the drop down, make sure the bar graph is selected. (then click “Show Me” again to make it disappear)
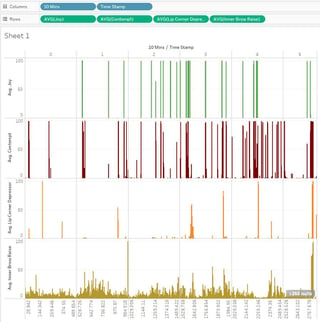
Review and Analyze
Now you have your data organized and ready to review. In mobile gaming, the game is always capturing other telemetric dat,, If you have not combined this data with your emotion data, as suggested in section two, then using it alongside your emotion data is also valuable. For example, you can go to the timestamp of a purchase event, and find the corresponding timestamp in your emotion curve to find out what the player was feeling at the time of purchase. Even more important, you can read the emotion data just before a purchase and find the profile that lead to a purchase. Repeating such experiences could be a valuable way to tune your game.
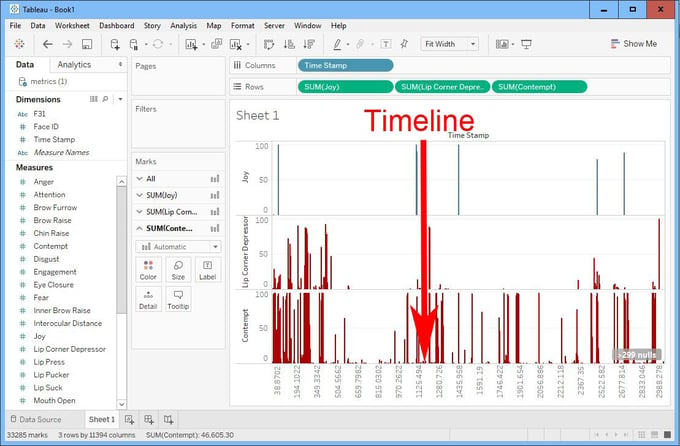
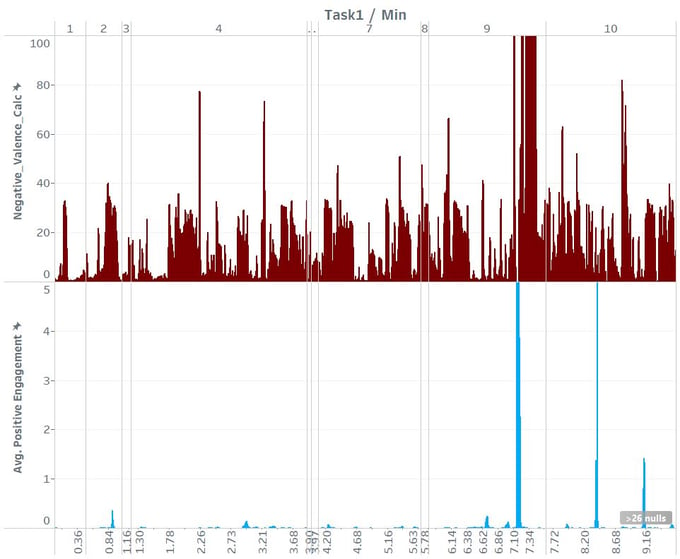
Also, you can work backwards by finding the places where the negative indicators “Lip Corner Depressor” and “Contempt” in the emotion curve read at over 50. Events that register over 50 can be considered “Significant” and are usually what data scientists pay attention to. If the reading is less than 50, what the graph is telling us is that there is a less than 50% chance that this action is occurring. I usually look for actions over 50 and in clumps timewise which would indicate there is definitely something negative happening in the player’s experience. After isolating one of these negative reactions, you can pick up you telemetric data and find out what was happening at the time. You can work backwards using the “joy” or positive reactions in the same way.
Aggregate by Task to save time
Another very valuable way to view your data is to organize it by task. This will only work if you have integrated the emotion data output with your telemetric “Task” data as mentioned in section two. However if this is the case, here is how you can set it up in Tableau:
Next, drag the second CSV file over the first one, like below:
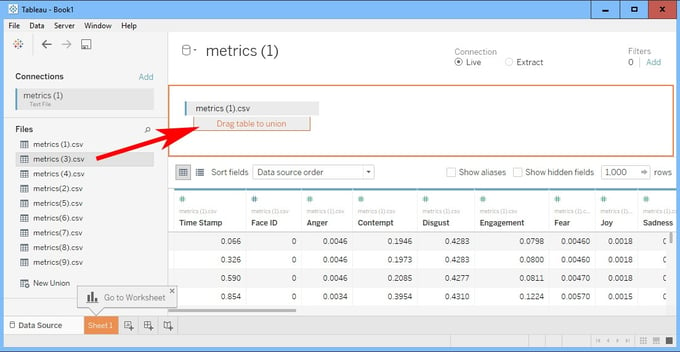
Repeat this process with all of the CSV files from your test. Once done you will have all of the data from your playtest consolidated. Then go to sheet one.
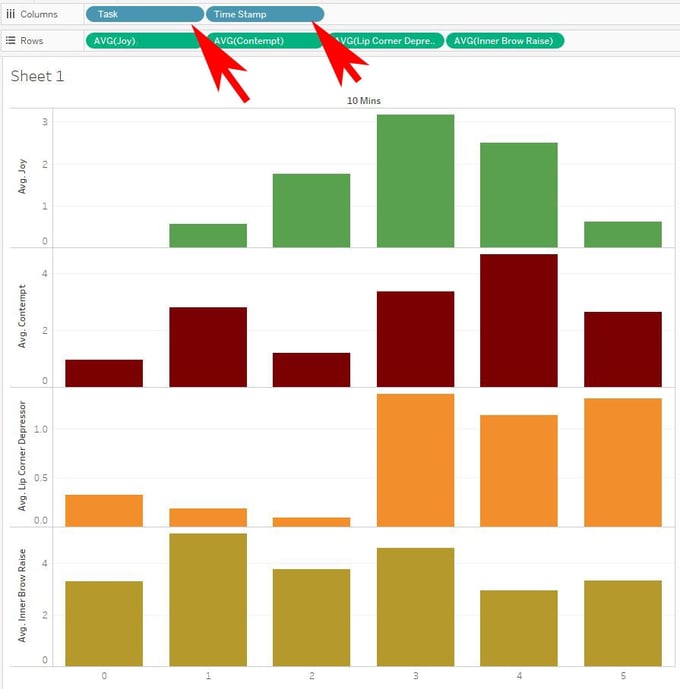
- Drag the “Task” Dimension into the Columns slot
- Second drag the “Time Stamp” Dimension into the Columns slot. Make sure that task is first and Timestamp is second.
- Next drag your Measures onto the Rows slot as above.
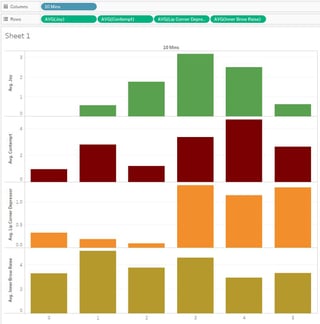
Once this is accomplished you can use the aggregate sheet to identify the problem areas.
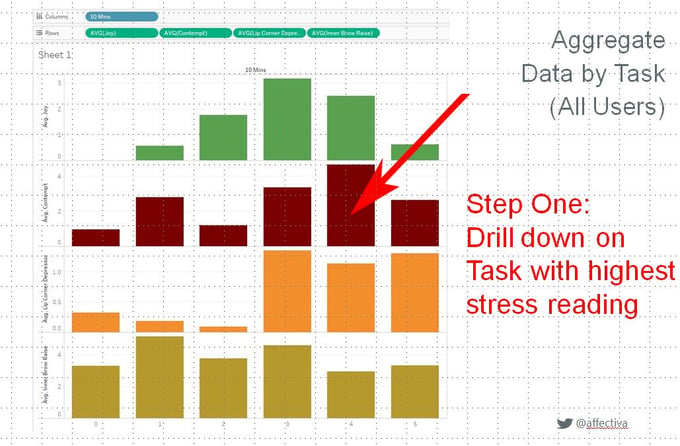
And then drill down by going to one of the individual graphs with the highest reading in this area:
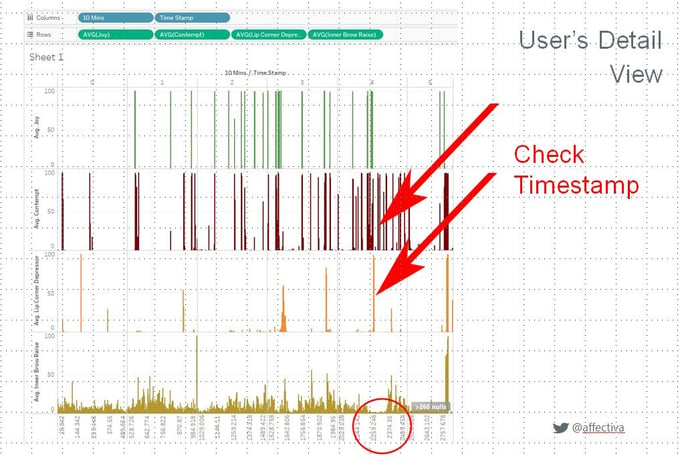
And then you can work backwards even further by checking your telemetric data. Or can can simply look at your game and decide what is frustrating about the task in questions. This process can be used to iron out frustrating issues with any of the areas you have flagged in your game’s telemetry. In this way a developer can quickly identify and analyze the problem areas without having to scrub through all the data from every user. This could be especially useful in a larger open beta test. Time saved in this way can translate into quicker fixes and fast iteration times, resulting in a more polished experience for the user and less time analyzing and deciding what’s broken. In today’s competitive market, a better user experience will help your game succeed.
Not only is emotional data an accurate and efficient way to polish your game, it can be fun too. We have noticed some interesting trends in interactive data analysis. One of them is the fact that often, when there are a large number of negative, frustration actions recorded, right at the place where the red marks stop, there is often a big smile. This indicates that the user has solved a problem and is happy about it. Additionally, occasionally in the case of competitive action titles, a long stretch of no significant emotional reactions at all, can mean that the player is doing very well. It indicates that they are “in the zone” so to speak. Their concentration is up, their reactions are tuned and they are not reacting emotionally, good or bad.
Anyway, I hope this helps!